Available

Padel market radar

Check data freshness, select clubs and court filters, then compare observed occupancy signals across daily, historical, heatmap and court views.

ForClub owners
Market Radar dashboard with court-availability KPIs for the selected period

How to start a reliable radar review

Open Dashboard → Market Radar and first check Last revision and revision count. Select the clubs you want to compare, then choose court type and zone so every KPI and chart is read against the same scope.

01

Open Dashboard → Market Radar

Begin on Overview and let the merged observation data load before comparing values.
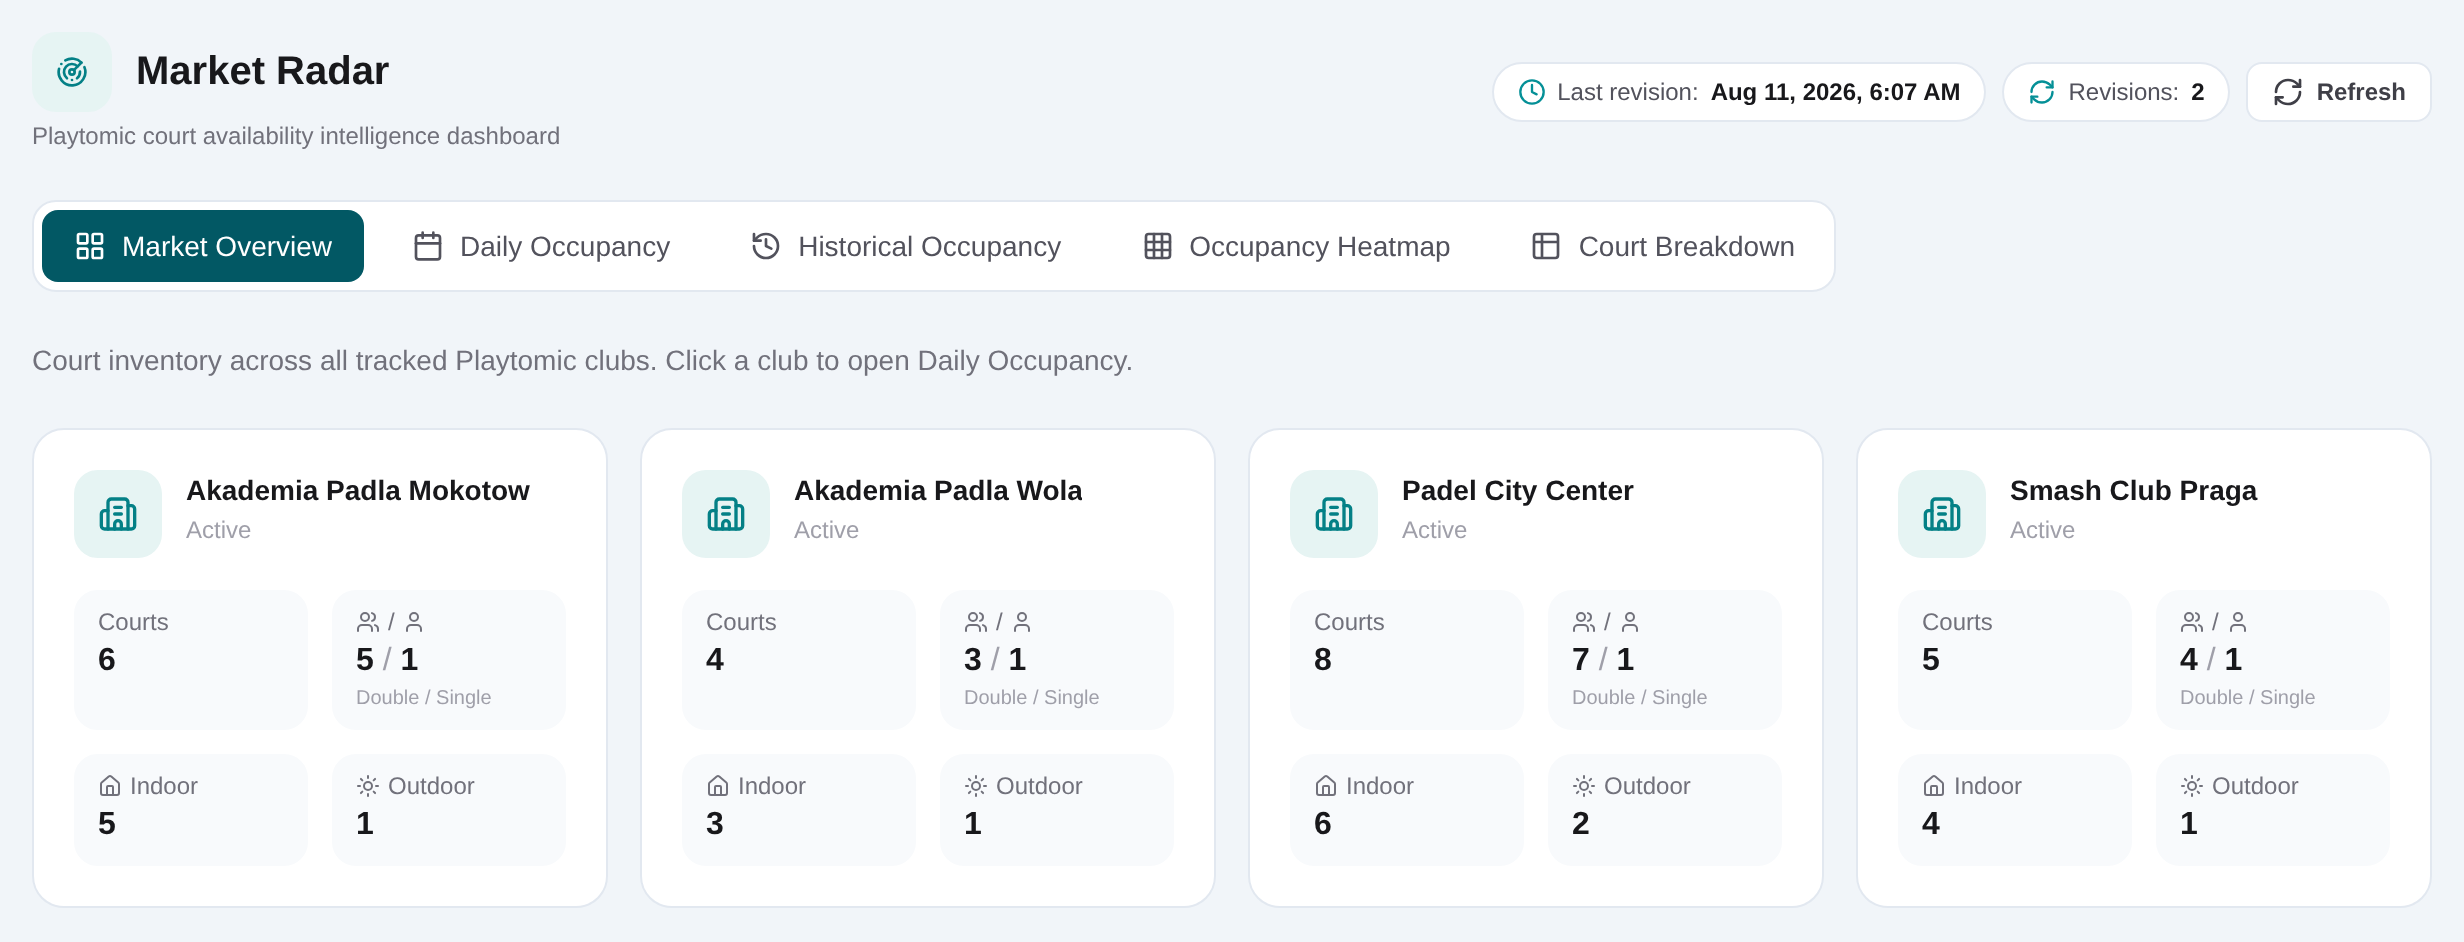
Market Radar dashboard with court-availability KPIs for the selected period
The overview turns observed court availability into period and club-level market research signals.
02

Check Last revision and revision count

Read the timestamp and number of revisions first. Treat sparse or stale coverage as a limitation on the analysis.

03

Select the clubs to compare

Use the club selector to create a focused comparison rather than mixing unrelated venues.

04

Set court type and zone

Choose double or other available court type scope and the relevant zone. Keep these filters consistent across tabs.

05

Read period KPIs as observed signals

Compare Today, next 5, next 7 and next 14 day views where available; do not interpret the percentage as a guaranteed booking forecast.

06

Open Heatmap for day-and-time concentration

Choose 5-day, 7-day or historical mode, then compare selected clubs with the same weekday and court filters.
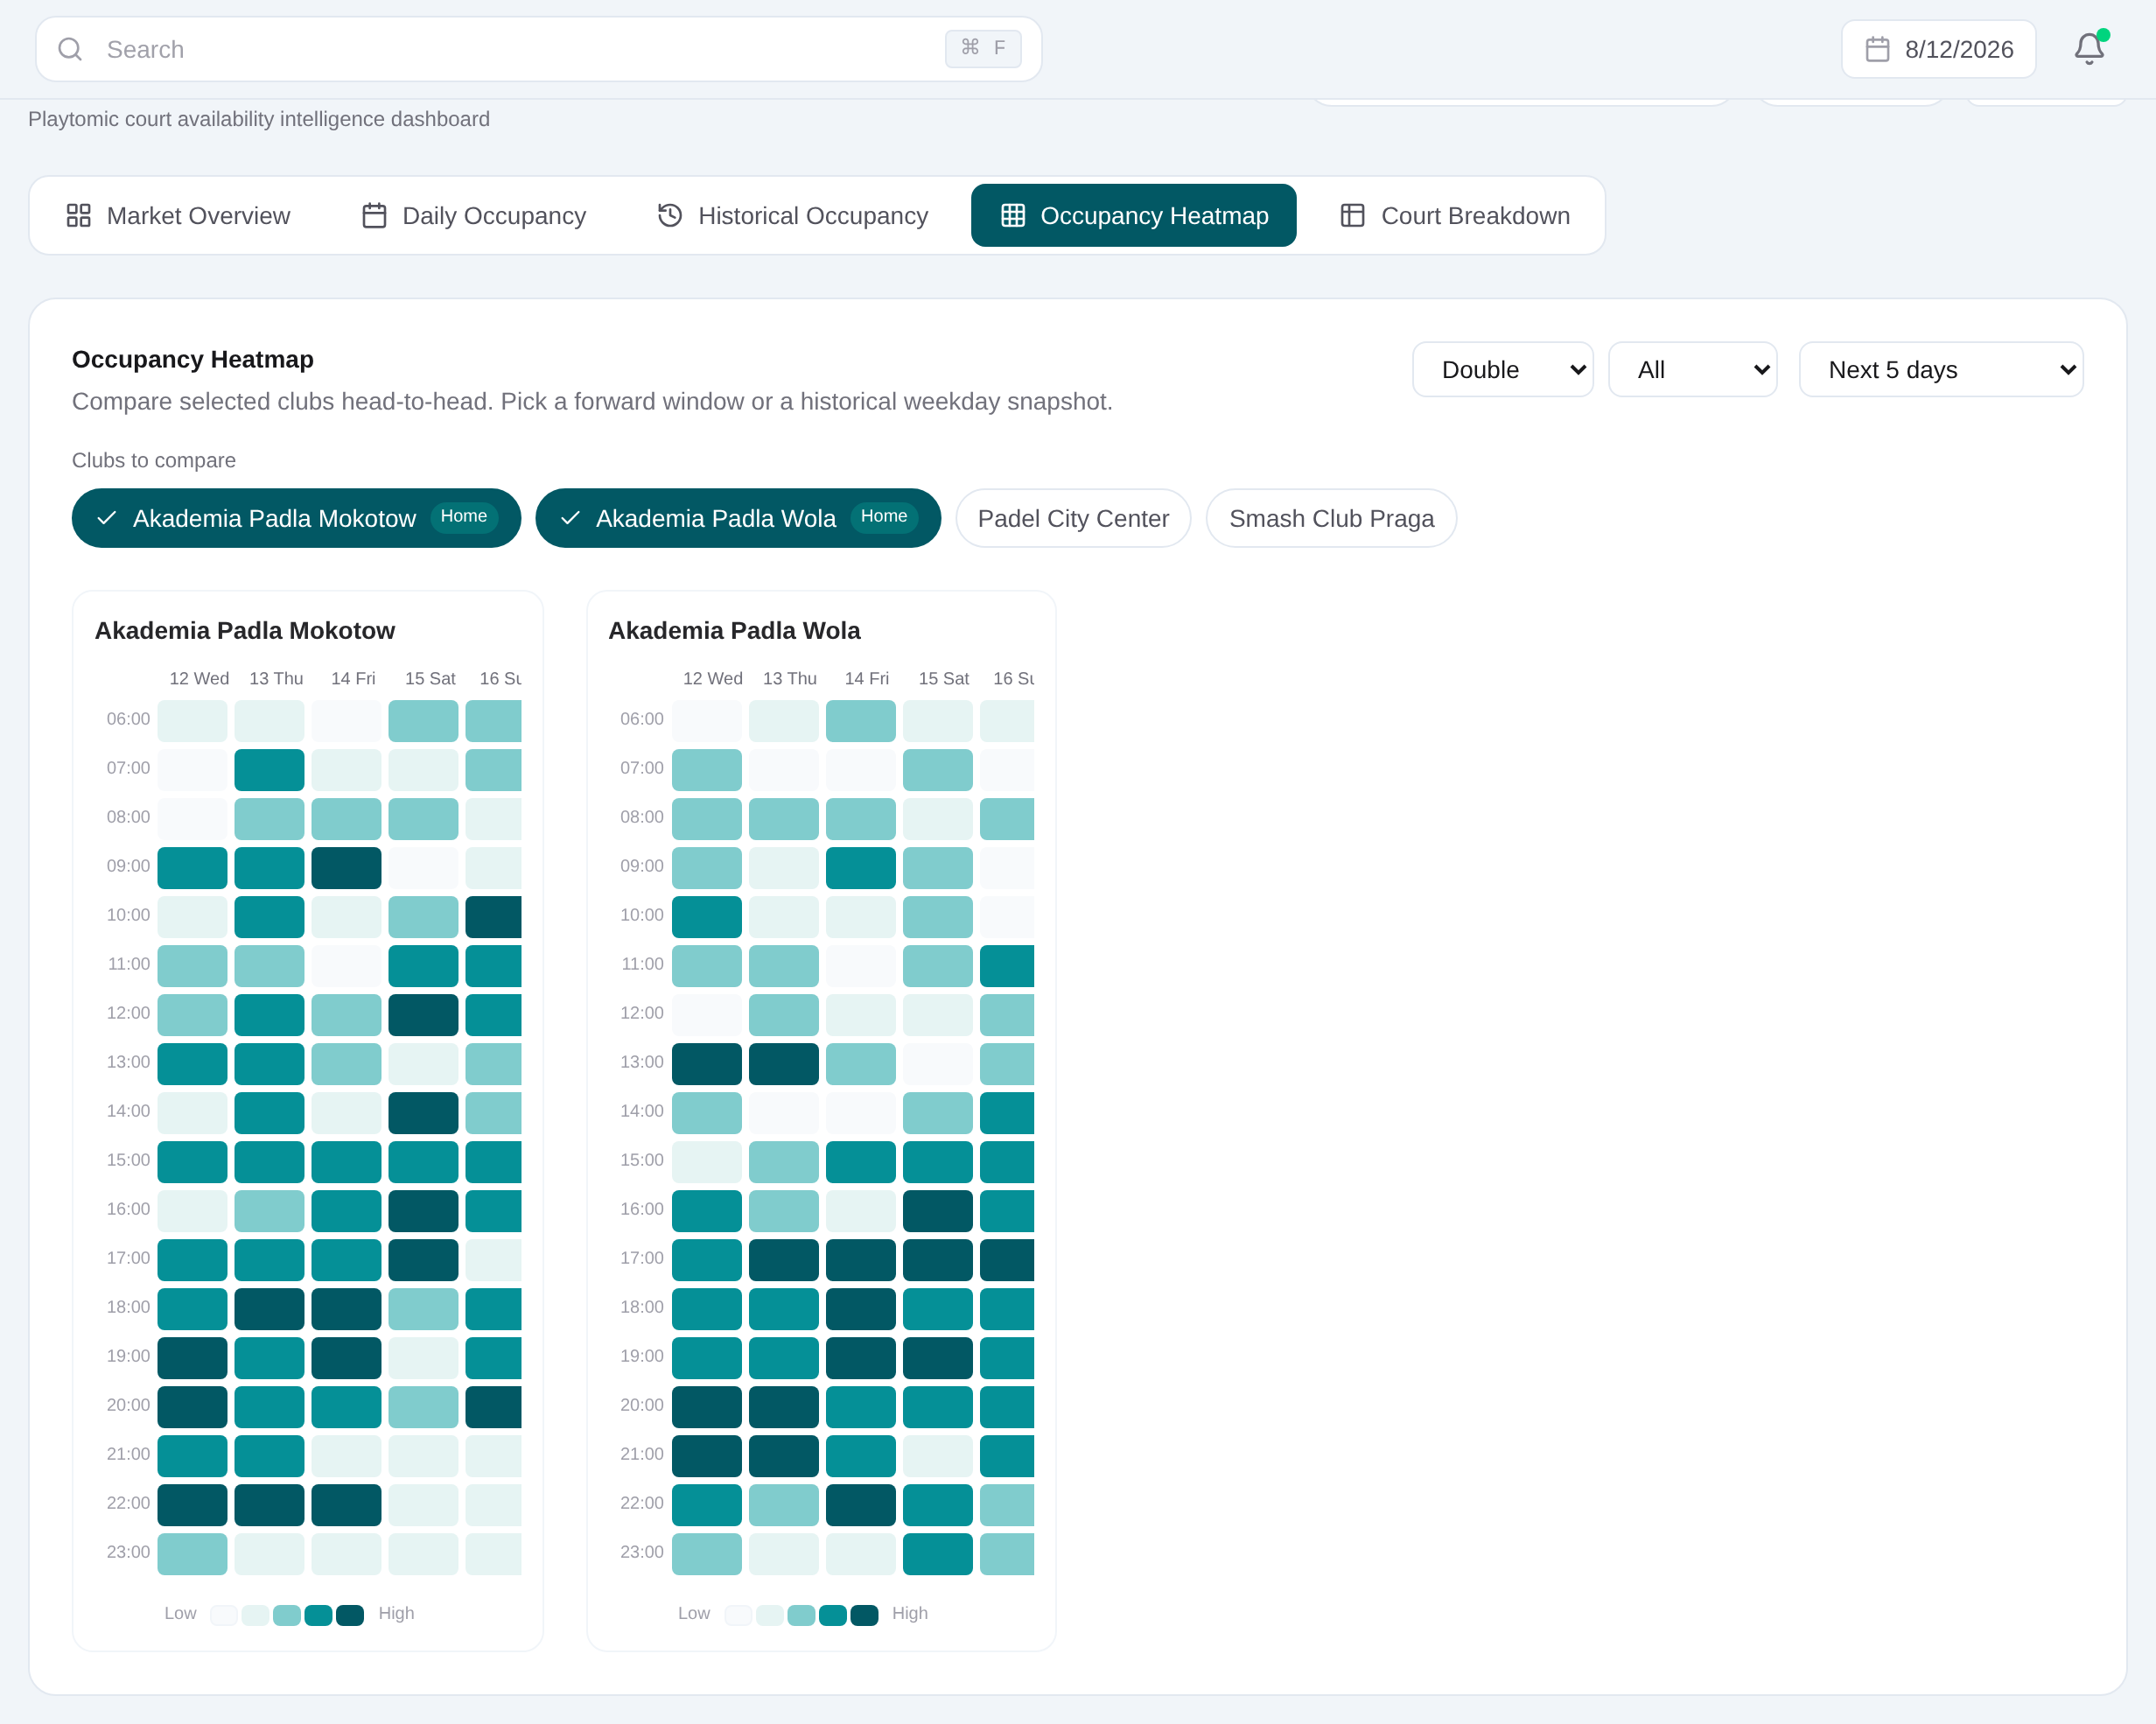
Market Radar heatmap showing observed availability by day and time
Use the heatmap to compare when observed court availability is concentrated across the selected data.
07

Review Historical and Courts tabs

Use weekly and monthly columns for repeated patterns, then inspect the court breakdown to see whether an aggregate is driven by particular courts.

Market Radar dashboard with court-availability KPIs for the selected period
The overview turns observed court availability into period and club-level market research signals.

Move from signal to detail

Use Overview for headline context, Daily Occupancy for near-term patterns, Historical Occupancy for weekly and monthly comparisons, Heatmap for day-and-time concentration, and Courts for row-level breakdown.

Market Radar heatmap showing observed availability by day and time
Use the heatmap to compare when observed court availability is concentrated across the selected data.

Treat observed availability as research evidence

Radar data is an observation of court availability, not an official Playtomic partnership feed, reservation service or guarantee of future demand. Use freshness and revision coverage when judging a pattern.

Frequently asked questions

Related content

Padel market radar

Check data freshness, select clubs and court filters, then compare observed occupancy signals across daily, historical, heatmap and court views.

Contact us